The Effects of the “Speak with Intent” Instruction for Individuals With Parkinson’s Disease
June S. Levittl and Delaina Walker-Batson2
lDepartment of Communication Sciences & Disorders, Texas Woman’s University, United States
2Department of Communication Sciences & Disorders, T. Boone Pickens Institute of Health Sciences, Texas Woman’s University, United States
KEYWORDS
Parkinson’s disease, Speech, Speech disorders, Voice disorders, Acoustic analysis, Smoothed cepstral Peak prominence, Acoustic voice quality index, Quality of life, Speak out
ABBREVIATIONS
QQL: Quality of Life
CPPS: Cepstral Peak Prominence
V-RQOL: Voice-Related Quality of Life
AVQI: Acoustic Voice Quality Index
ABSTRACT
The goal of the present study was to examine the changes in the quality of the voice signals and the perception of Quality of Life (QOL) of individuals with Parkinson’s disease (PD) as a result of the “Speak with Intent” instruction of the SPEAK OUT!® treatment program for PD. The SPEAK OUT!® program utilizes an instruction as “Speak with Intent” combined with a group therapy program called LOUD Crowd® that follows the one-on-one SPEAK OUT!® program to maintain improved verbal communication. Twenty-three individuals with PD participated in one of the two conditions. Seventeen participants were in the Treatment group, and six participants were in the Control group. Each participant’s voice was recorded four times over the 12-week research period at equal intervals. Outcome measures included (1) the mean vocal intensity from passage reading, (2) Cepstral Peak Prominence (CPPS), (3) Acoustic Voice Quality Index (AVQI), and (4) Voice-Related Quality of Life (V-RQOL). The group differences were contrasted as a between-subject factor. The changes over time were examined as a within-subject factor. The participants in the Treatment group showed statistically significant main effects of the pre- and post-treatment measurements in all aspects.
The participants in the Control group showed minor or no changes over the 12-week research period. The “Speak with Intent” instruction resulted in improved vocal intensity, voice signals, and perception of the Quality of Life.
INTRODUCTION
Parkinson’s disease (PD) is a common neurodegenerative disease [1]. As of 2010, an estimated 630,000 individuals in the United States had been diagnosed with PD. Trend analysis of the current data suggests the number of PD cases double by 2040 [2]. Because of the reduction of the Dopamine-producing cells in the Substantia Nigra, individuals with PD experience various difficulties in movements. The deficits associated with PD also disrupt sensory functions. The weakened sensory awareness exponentially affects movements, because every human movement is guided by the sensory information [3].
The complexity of speech production requires coordination of respiration, phonation, and articulation [4]. The movement disturbances with PD commonly present with reduced movement amplitude (hypokinesia) and slow movements (bradykinesia). With speech, the reduction of movement amplitude often results in hypokinetic dysarthria. According to Duffy [5], approximately 90% of individuals with PD experience difficulties in speech due to reduced vocal intensity (perceived as “loudness”), breathy voice quality, limited vocal pitch, and unclear articulation [5].
The speech/voice remediation methods for PD primarily focus on the restoration of the intensity of speech. In particular, Lee Silverman Voice Treatment (LSVT®) is the most widely known and studied method [6]. With the slogan “Think Loud, Speak Loud,” LSVT® focuses on increasing vocal intensity as its single target. The generalized effects of the increased vocal intensity have been reported by multiple researchers to date [7,8]. Other programs for PD also address the vocal intensity, implementing different approaches. For example, the Pitch Limiting Voice Treatment (PLVT) [9] guides the individuals with PD with an instruction of “Speak Loud and Low” so that the efforts to increase vocal intensity do not result in an excessive increase of the fundamental frequency (perceived as “pitch”) and subsequent hyper-tension of laryngeal muscles [9,10].
SPEAK OUT!®, a speech/voice remediation program for PD, aims at increasing vocal intensity, clarity, and thinking processes by applying intention in verbal communication to compensate for the weakened automatic approximation of the movement amplitude of the structures for voice/speech production due to PD, with its catchphrase of “Speak with Intent” [11]. The goal of the “intent” instruction is to activate the voluntary efforts for verbal communication. The instruction is not pointing to one specific behavioral target based on the idea that the speech deficits with PD are not localized to the inability to adjust specific speech parameters, such as vocal intensity or articulation [12]. With the “intent” instruction, SPEAK OUT!® is designed to improve the verbal communication holistically. The basic format of the SPEAK OUT!® includes 12 one-on-one sessions administered by a certified Speech-Language pathologist (SLP) over four weeks. The program takes a criteria-based approach to achieve the desired intelligibility, basing a varying number of the sessions on each person’s progress.
After completing the SPEAK OUT!® program, each participant is assigned to a weekly group therapy program called LOUD Crowd®. The clinic organizes multiple LOUD Crowd® groups to accommodate the members’ interests and orientations. The LOUD Crowd® intends to provide social opportunity, as well as maintaining improved speech and voice achieved by the SPEAK OUT!® sessions. Previously, the effects of the SPEAK OUT!®/LOUD Crowd® were reported for vocal intensity and the expansion of the vowel space estimated by the changes of Formants 1 and 2 (F1 and F2 [13,11].
The goal of the present study was to examine the changes in the quality of the voice signals obtained by the “Speak with Intent” instruction of the SPEAK OUT!® and LOUD Crowd® programs, as well as the vocal intensity and the perception of the Voice-Related Quality of Life (V-RQOL). The vocal quality could be measured by time-based methods and spectral-based methods. Traditionally used examples of the time-based methods are jitter and shimmer measurements, which identify the irregularity of the fundamental frequency and intensity, respectively. These time-based measurements are pertinent when the voice signals display steady cyclic vibrations without presenting obviously perceivable distortions [14]. In contrast, the spectral-based measurements use the snapshots of the recorded voice without relying on the cycle boundaries to identify aperiodicity [15]. Because dysphonic voices are commonly inconsistent, the spectral-based measurements or the combination of the time- and spectral-based measurements are suitable to examine the overall quality of produced speech/ voice. The present study measured the Smoothed Cepstral Peak Prominence as a method of spectral analysis using PRAAT (v.6.0.08) [16] and its script developed by Maryn and colleagues [17]. The script was also used to measure the Acoustic Voice Quality Index (AVQI). Acoustic Voice Quality Index (AVQI) is a multivariate method to measure dysphonia, using continuous speech and sustained vowel phonation. The sustained vowel provides information about relatively steady actions of voicing, and continuous speech includes information about the temporal and spectral variations caused by the various demands for speech production. AVQI computes an index from multiple figures including Harmonic-to-Noise Ratio, CPPS, Shimmer, Slope of the long-term average spectrum (LTAS), and Tilt of the trend line through LTAS [17,18]. AVQI provides a method to clinically measure overall dysphonia severity, and it is increasingly utilized to determine overall voice quality [17,19-21].
Mean vocal intensity in the connected speech was measured from the reading of the Rainbow passage [22] to explore the relationship between different aspects of speech. Lastly, the self-rated Quality of Life (QOL) relevant to the verbal communication was measured by using the ten questions on the Voice-Related Quality of Life (V-RQOL) to contrast with the acoustic markers of produced speech/voice. The present study adopted a mixed design with the Treatment or Control group as a between-subject factor and the time-course changes of verbal outputs over the 12-week research period as a within-subject factor.
MATERIALS AND METHODS
Participant
The participants were recruited from the Parkinson Voice Project clinic in Richardson, Texas. The study called for participants who are (1) diagnosed with idiopathic PD by neurologists specializing movement disorders, (2) 40 to 80 years of age, (3) monolingual speakers of General American English (GAE), (4) right-handed, (5) hearing and vision within normal limits with or without corrections by self-report, and (6) not diagnosed with other neurogenic and psychiatric conditions that could affect the ability to follow the researchers’ instructions. Twenty-three participants completed the study, including 16 males and seven females, with ages ranging from 45 to 78 years old (Mage = 66; SD = 9) (Table 1).
| AGE | PD Diagnosis | Years between PD Diagnosis and Participation to the Present study | ||
|---|---|---|---|---|
| Treatment | TX1-M | 65 | 2012 | 2 |
| TX2-M | 77 | 2006 | 8 | |
| TX3-M | 77 | 2012 | 2 | |
| TX4-M | 60 | 2009 | 5 | |
| TX5-M | 62 | 2012 | 2 | |
| TX6-M | 69 | 2013 | 2 | |
| TX7-M | 78 | 2009 | 6 | |
| TX8-M; | 54 | 2012 | 3 | |
| TX9-M | 68 | 2009 | 6 | |
| TX10-M | 71 | 2012 | 3 | |
| TX11-M | 76 | 2011 | 4 | |
| TX12-F | 75 | 2013 | 1 | |
| TX13-F | 58 | 2001 | 13 | |
| TX14-F | 76 | 2012 | 2 | |
| TX15-F | 63 | 2013 | 1 | |
| TX16-F | 61 | 2014 | 1 | |
| TX17-F | 58 | 2013 | 2 | |
| Control | CO1-M | 45 | 2008 | 6 |
| CO2-M | 76 | 2008 | 6 | |
| CO3-M | 63 | 2001 | 13 | |
| CO4-M | 78 | 2014 | 1 | |
| CO5-M | 56 | 2010 | 5 | |
| CO6-F | 58 | 2012 | 2 | |
| Mean | 66 | |||
| SD | 9 |
Table 1: Participants
Twenty-two participants are on Stage 1 of the Hoehn and Yahr Scale of the Parkinson’s disease stage [23], presenting with unilateral involvement of minimal funtional impairments. One participant was on Stage 2 of the Hoehn and Yahr Scale [23], presenting with bilateral involvement without impairment of balance. All participants continued their medications, as optimally prescribed by their physicians throughout the research period without changing the type or dosage. The participants could opt out of the therapy. Seventeen participants chose to enroll in the treatment group, and the remaining six participants decided to be in the Control group. All participants completed consent process before participating in the study.
Data Collection
The data were collected four times during the 12-week study period at equal intervals including (Time 1) baseline, (Time 2) the end of the 12 one-on-one therapy sessions of the SPEAK OUT!® program over four weeks, (Time 3) after four weekly group therapy LOUD Crowd® sessions, and (Time 4) after four more subsequent weekly group therapy LOUD Crowd® sessions. Despite the criteria-based approach of the SPEAK OUT!® program, all the participants in the Treatment group attended three sessions per week over four weeks (12 sessions) regardless of the level of the progress they made. This uniform therapy schedule was enforced to maintain a consistent number of therapy sessions. Four ASHA-certified Speech-Language Pathologists (CCC-SLP) at the Parkinson Voice Project clinic administered the therapy sessions without knowing the purpose of the study. The participants in the Control group had four voice recording sessions over the 12-week study period without receiving the speech/voice therapy
For each participant’s four voice-recording meetings, efforts were made to keep the data collection at equal 4-week intervals and the meetings at the same time of the day. However, some participants could not follow the schedule precisely because of various health conditions or transportation arrangements. The data collection was carried out with a single participant at a time in a quiet room in the Parkinson Voice Project clinic in Richardson, Texas.
One of the researchers (the first author) recorded the participant’s voice using two sets of recording devices. Each set consists of a laptop computer with a Solid-State Drive (SSD) and a desktop condenser microphone (Yeti USB Microphone) in the Cardioid mode. The microphone of one set was placed 30 cm from the participant’s mouth to measure the vocal intensity. The vocal intensity of the treatment group could potentially clip sound waveforms during the post-treatment phases. For the spectral analysis, waveforms with clippings could cause artifacts. Therefore, the secondary microphone was placed farther from the primary one to ensure recording without clipping. The Audacity (v. 2.1.1) audio software program was used to directly record the participant’s voice data on the computers via attached microphones.
Materials
Voice Recordings: The same set of materials was recorded four times over 12 weeks. The set included (1) sustained corner vowels for six seconds (/a/, /i/, and /u/), (2) the six sentences from the Consensus Auditory-Perceptual Evaluation of Voice (CAPE-V) protocol [24,25], and (3) the reading of the Rainbow passage [22] (Table 2). Three repetitions were recorded for the first two types of material, and one attempt for the third. The materials were presented in the random order for each session and participant to prevent an order effect [26]. The recorded materials were not included in The SPEAK OUT!® therapy program. The only similar material to the therapy program was the phonation of the vowel /a/. The SPEAK OUT!® therapy program includes the longest possible sustained /a/ phonation to improve the coordination of the speech breathing and phonation
The researcher prompted the participant to produce speech/voice or read the materials at his/her comfortable pitch and loudness levels. The beginning and end of the 6-second sustained vowel phonation were prompted by the researcher’s hand gestures to start and end. The materials were placed at the participant’s eye level to optimize his/her posture for voice production by properly adjusting a document stand. To ensure hydration, the researcher frequently reminded participants to sip water during the voice recording.
| Type | Specific Materials |
|---|---|
| Passage Reading | Rainbow Passage [22] |
| Sustained Vowel Phonation (for 6 seconds) | /a/, /i/ and /u/ |
| “The blue spot is on the key again” | |
| CAPE-V: Sentences [24,25] | “How hard did he hit him?” |
| “We were away a year ago” | |
| “We eat eggs every Easter” | |
| “My mama makes lemon muffins” | |
| “Peter will keep at the peak” |
Table 2: Materials Used for Voice Recording
Quality of Life Perceptions: The participant’s perceptual ratings of their voice and its reflection on the quality of life were assessed by using the ten questions of the Voice-Related Quality of Life (V-RQOL) [27] (see Table 3). After presenting a sheet with the information about the participant’s rating options (Likert scale: 1 through 5), the researcher (the first author) read each question on the V-RQOL and recorded the participant’s responses. After the participant had finished answering all ten questions, the researcher reviewed each question to verify the participant’s responses.
| Type | Question |
|---|---|
| P | I have trouble speaking loudly or being heard in noisy situations |
| P | I run out of air and need to take frequent breaths when talking |
| P | I sometimes do not know what will come out when I begin speaking |
| P | I have trouble using the telephone (because of my voice) |
| P | I have trouble doing my job or practicing my profession (because of my voice). |
| P | I have to repeat myself to be understood |
| S | I am sometimes anxious or frustrated (because of my voice) |
| S | I sometimes get depressed (because of my voice) |
| S | I avoid going out socially (because of my voice) |
| S | I have become less outgoing (because of my voice) |
Data Analysis
The Audacity (v. 2.1.1) audio software program was used to segment the recorded materials. The PRAAT Acoustic Analysis Software Program (v.6.0.08) [16] was used for acoustic analyses of the recorded voice/speech data. Four outcome measurements, including the vocal intensity, CPPS, AVQI, and V-RQOL, were examined and contrasted.
The statistical analyses were carried out with IBM SPSS Statistics 24 (v.24.0.0.0). The significance level was set at p < .05. A series of repeated measure analysis of variance (ANOVA) was conducted using the group (Treatment group or Control group) as the between-subject factor and the recording phase (Time 1, 2, 3, or 4) as the within-subject factor. When the assumption of sphericity was violated as assessed by Mauchly’s test of sphericity, the Greenhouse-Geisser correction was applied. When statistically different results were found in the within-subject factor, pairwise comparisons with Bonferroni corrections were computed to identify which pair of phases contributed to the significant differences (i.e., Time 1 vs. Time 2; Time 1 vs. Time 3; Time 1 vs. Time 4, and so on). The results from the ANOVA analyses were further explored, with additional nonparametric analyses as needed.
RESULTS
Vocal Intensity
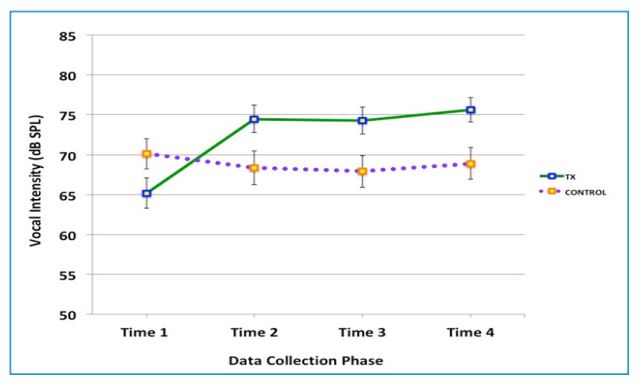
The vocal intensity was measured from the mean sound pressure level (dB SPL) of the “Rainbow Passage” [22] reading because the passage approximates the connected speech with multiple sentences and inflections required to make sense of the contents of the passage. Figure 1 shows the mean vocal intensity by group at each of the four recording phases. A repeated measure ANOVA (2 groups x 4 times) with Greenhouse-Geisser correction revealed a statistically significant interaction between the Treatment group and Control group over the four measurement periods, [F(2.18, 45.86) = 18.37, p < 0.001]. Vocal intensity was significantly increased over the four periods in the treatment group [F(3,48) = 41.619, p < 0.0005].
With the Control group, there was no significant effect of time on the changes of vocal intensity [F(1.75, 8.738) = 2.7, p = 0.125 ns]. For the Treatment group data, a series of pairwise comparisons were computed with the Bonferroni correction to adjust multiple comparisons. The pairwise comparison showed statistically significant differences between Time 1 vs. Time 2, Time 1 vs. Time 3, and Time 1 vs. Time 4.
Several types of nonparametric tests were performed to further examine the ANOVA results. First, Mann-Whitney U tests were used because the graph (Figure 1) shows the mean vocal intensity scores of the Control group at the baseline (Time 1) was higher than that of the Treatment group’s without overlaps. The result of the MannWhitney U test identified that there was no statistically significant difference between the groups at Time 1 (p = 0.135, ns). Next, a Friedman test of differences was computed for each group. The test rendered a statistically significant change in the Treatment group across the four phases with the Chi-Square value of 32.08 (p < .001) and no statistically significant change in the Control group with the Chi-Square value of 6.60 (ns).
Smoothed Cepstral Peak Prominence (CPPS) Analysis
Using the PRAAT (v. 6.0.08) script developed by Maryn and Weenink [17], the Smoothed Cepstral Peak Prominence (CPPS) was computed to examine the change in the voice signal (Figure 2). The CPPS shows how one’s speech signal distance from the surrounding noise signals at the given moment. The greater figures of the CPPS reflect the more prominent voice signal over the noises. Maryn and colleagues [18] reported in the recent study that the mean CPPS figure of the normal voice was 16.77 or higher with a standard deviation of 2.08.
Results from the ANOVA with the Greenhouse-Geisser correction revealed a statistically significant interaction between groups and times on the CPPS, [F(1.66, 34.82) = 6.48, p < 0.01]. There was a statistically significant main effect of time on the change of vocal quality for the Treatment group [F(1.61, 25.83) = 15.28, p <0.001] with the Greenhouse-Geisser correction. There was no significant main effect on CPPS over time with the Control group [F(3,15)=1.543, p = 0.244, ns]. A series of pairwise comparisons with the Bonferroni correction was performed with the Treatment group data to identify where the significant change occurred. The pairwise comparison results showed statistically significant differences between Time 1 vs. Time 2 (p = 0.005), Time 1 vs. Time 3, (p = 0.005), and Time 1 vs. Time 4 (p = 0.005). No significant difference was found in any combination of Times 2 through 4. A subsequent nonparametric test, the Friedman test of differences confirmed a statistically significant change in the Treatment group across the four time points with the Chi-Square value of 16.27 (p < .001), and no statistically significant change in the Control group with the Chi-Square value of 3.00 (ns).
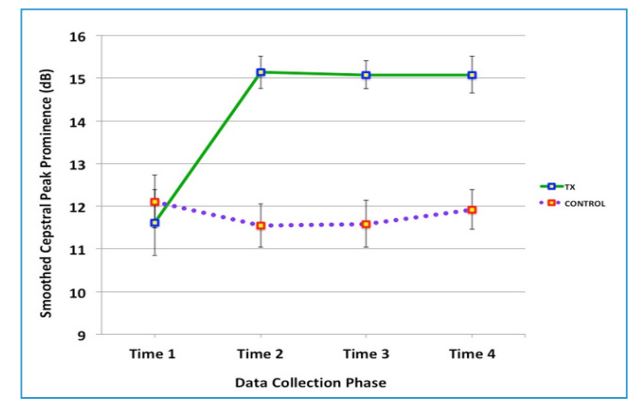
Figure 2: Change in the Strength of the Voice Signal, Measured by the Smoothed Cepstral Peak Prominence (CPPS) Figures
The figures show how prominent the voice signals were over the noises. In a recent study by Maryn and colleagues [18], the mean CPPS figure of normal voice was 16.77 or higher with a standard deviation of 2.08. The error bars show the Standard Error Mean (SEM). The Green solid line shows the result for the Treatment group, and the purple dotted line shows that for the Control group.
Acoustic Voice Quality Index (AVQI) Analysis
The AVQI was computed by using the PRAAT script developed by Maryn and Weenink [17]. According to Maryn and colleagues [18], an AVQI figure of 2.95 or lower indicates normal voice, with estimated sensitivity of 74% and specificity of 96%. The authors explained that almost all participants in their study with normal voice quality were correctly classified as such by using the AVQI scores lower than 2.95. A statistically significant interaction was identified between the group and four data collection phases on vocal quality, as measured by the AVQI figures, [F(17.67, 39.70) = 9.34, p < 0.001], with the Greenhouse-Geisser correction. The Treatment group showed a statistically significant main effect of time on the change of AVQI, [F(1.43, 22.84) = 20.24, p < 0.001], with the Greenhouse-Geisser correction. There was no significant effect of time on the change of AVQI for the Control group [F(3, 15) = 1.34, p = 0.30, ns]. The pairwise comparisons with Bonferroni correction for the Treatment group data identified the statistically significant differences between Time 1 vs. Time 2 (p = 0.001), Time 1 vs. Time 3, (p = 0.005) and Time 1 vs. Time 4 (p = 0.001). No significant difference was found in any combination of Times 2 through 4.
The ANOVA results were further explored with a series of nonparametric Friedman tests. Friedman test of differences rendered a statistically significant change in the Treatment group across the four time points with the ChiSquare value of 30.60 (p < .001), but no statistically significant change in the Control group with the Chi-Square value of 3.40 (ns) (Figure 3).
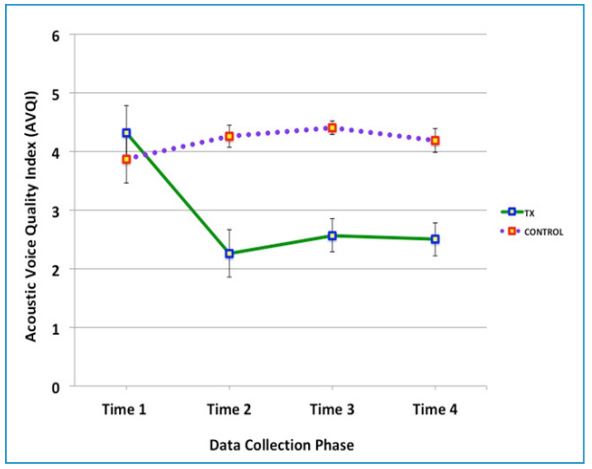
Figure 3: Change in the Vocal Quality, Measured by the Acoustic Voice Quality Index (AVQI)
AVQI is a multivariate voice quality measurement. A recent study by Maryn and colleagues [18] reported the AVQI scores lower than 2.95 indicate normal voice. The error bars show the Standard Error Mean (SEM). The Green solid line shows the result for the Treatment group, and the purple dotted line shows that for the Control group.
Voice-Related Quality of Life (V-RQOL) Analysis
Participants provided information about the impact of their verbal communication to their lives by responding to the ten questions on the V-RQOL. As such, the V-RQOL data were collected four times during the 12-week research period. The questions in the V-RQOL are classified into two domains, including physiological functions (six questions) and social/ emotional functions (four questions) (see Table 3). The participant’s responses were collected in the format of a five-level Likert scale (see Table 3). Following the formula described by Hogikyan and Sethuraman [27], the collected raw data were converted into the V-RQOL indices. Prior to the statistical analyses, a series of Cronbach’s alpha was computed to inspect the internal consistency of the raw responses and the V-RQOL indices. The V-RQOL Index figures presented with a high level of internal consistency with the raw data, as determined by a Cronbach’s alpha of 0.85 and 0.83 for the physiological and social questions, respectively. The figures of the Cronbach’s alpha of 0.7 or higher are interpreted as reliable [28,29]. As the next step, a Pearson’s product-moment correlation was examined to assess the relationship between the responses to the questions in the physiological and social/emotional domains. There was a strong positive correlation between the responses for these two domains (r = 0.861). Therefore, the responses to all ten questions of V-RQOL were analyzed together without separating the physiological and social domains (Figure 4).
There was no statistically significant interaction in the Treatment and Control groups in the quality of life perception, measured by the Voice-Related Quality of Life (V-RQOL), [F(1.72, 36.10) = 2.64, p = 0.09, ns]. The V-RQOL of the Treatment group presented with a statistically significant main effect of time on the change of the perception of the quality of life with the Green-Geisser correction, [F(1.67, 26.59) = 14.225, p <0.0005]. There was no significant main effect of time on the change of V-RQOL for the Control group [F(1.80, 8.97) = 3.47, p = 0.80, ns].
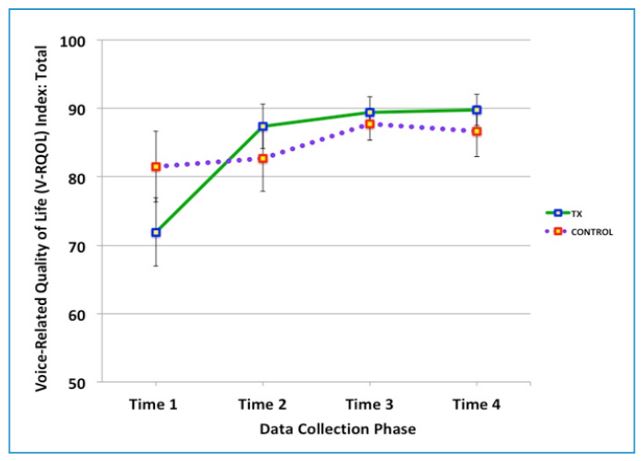
Figure 4: Change in the Voice-Related to Quality of Life (V-RQOL) indices
V-RQOL contains ten questions related to physiological and social/emotional dimensions. The figure shows the total scores from all ten questions rated by the participants. The error bars show the Standard Error Mean (SEM). The Green solid line shows the result for the Treatment group, and the purple dotted line shows that for the Control group.
DISCUSSION
The goal of the present study was to quantify the changes in the quality of voice signals yielded from the voice remediation program with domain-general instruction, “Speak with Intent.” The data collected from 23 individuals with PD were measured by the vocal intensity, CPPS, AVQI, and V-RQOL. The acoustic analyses of voice focused on the passage and sentence productions at the participant’s comfortable loudness and pitch level, instead of the maximum performance of sustained vowel productions.
The measured CPPS and AVQI [17] from the collected data at four points during the 12-week research period showedstatistically significant interactions between the two groups. The CPPS and AVQI revealed statistically significant improvements in the voice signalswith the Treatment group and almost no change in the Control group. The present study also measured vocal intensity as an essential acoustic marker of the voice remediation studies with PD. The improvements in vocal intensity with the participants in the Treatment group are in agreement with the results obtained by the previous SPEAK OUT!® studies [13,11]. In contrast, the voice production with the participants in the Control group presented with moderate decline or no change.
The participant’s quality of life perception measured by the V-RQOL showed the increased scores with the participants in the Treatment group, consistent with the acoustic changes of their verbal communications. The results of the present investigation suggest that the “Speak with Intent” voice therapy guidance could improve the verbal communication of individuals with PD in terms of the voice signals, vocal intensity, and the perception of the quality of life that is related to the verbal communication.
The caveats of the present study are that (1) the participants were not randomly assigned to the Treatment or Control group, and (2) the number of participants in these two groups was not balanced. The results of the present study need to be replicated with a higher and equal number of participants in each group before they are generalized. In addition, the data collected in the present study should be further analyzed in several ways. First, an external listener’s ratings of the vocal quality are necessary to examine whether the acoustically measured improved vocal quality by CPPS and AVQI agree with the changes perceived by human ears. Second, another acoustic measurement of the Formants Frequencies would explore the changes in the estimated vowel spaces of the three corner vowels over time.
According to Kent [30], the speech signals transfer four different types of references including linguistic, emotional, personal, and transmittal information. Linguistic information is unique in human communications. Emotional information is commonly utilized across different species. Listeners can identify the emotional states in the human speech as well as in the ways many other species make different sounds in a variety of modes. Personal information provides some identifiable characteristics such as age, personality, and sex of the speakers. Transmittal information suggests the environment in which the verbal communication takes place, such as at a quiet room or in the restaurant. Therefore, the normal voice should have well-defined linguistic information with the proper representation of the talker’s emotional state and personality without being negatively influenced by the transmittal environments [30: pp. 2-4].
Effective verbal communication is possible by enabling these multifaceted elements to function in harmony. Therefore, it is essential for speech/voice remediation program to address the totality of voice signals as well as vocal intensity. The “intent” instruction potentially enhances the sensory awareness to reflect the motoric behavior, speech,with strengthened voice signals.
CONCLUSION
Unlike the pharmacological studies, clinical research in behavioral science contains additional variables regarding the way the remediation instructions and feedback are delivered. Motor Learning theories and principles were tested extensively with the limbs, but not speech [31,32]. It is vital to investigate the effects of different types of instructions and feedback methods on various speech learning and remediation conditions. Despite the limitations, the present study added evidence of the effects of voice remediation efforts and its impact on the perception of the quality of life for the individuals with PD.
ACKNOWLEDGEMENT
The present investigation was supported by the Texas Woman’s University Chancellor’s Research Fellow grants of 2014 and 2015. The authors thank Ms. Samantha Elandary, Kay Wiley, and their colleagues at the Parkinson Voice Project clinic in Richardson, Texas for their assistance with participant recruitments and scheduling. We also appreciate Dr. Adam Lund for his guidance with statistical analyses and Mr. Mark Levitt for his comments and editorial advice.
Financial and Non-financial Disclosures
The present research was funded by the Texas Woman’s University Chancellor’s Research Fellow grants of 2014 and 2015. The authors have no non-financial relationships to disclose.
REFERENCES
1. Pringsheim T, Jette N, Frolkis A, Steeves TD. The prevalence of Parkinson’s disease: A systematic review and meta‐analysis. Mov disord. 2014;29(13):1583-1590.
2. Kowal SL, Dall TM, Chakrabarti R, Storm MV, Jain A. The current and projected economic burden of Parkinson’s disease in the United States. Mov Disord. 2013;28(3):311-318.
3. Patel N, Jankovic J, Hallett M. Sensory aspects of movement disorders. Lancet Neurol. 2014;13(1): 100-112.
4. Fant G. Acoustic theory of speech production. Mouton, The Hague, 1960.
5. Duffy JR. Motor speech disorders: Substrates, differential diagnosis, and management. 3rd ed. St. Louis MO: Elsevier Mosby; 2013.
6. Tanaka Y, Tsuboi T, Levitt JS, Tanaka M, Tanaka N, et al. Voice and speech treatment of Parkinson’s disease: Treatment approach toward generalization. J Allied Health Scie. 2017;8(1):80-88.
7. Ramig LO, Sapir S, Countryman S, Pawlas AA, O’Brien C, et al. Intensive voice treatment (LSVT®) for patients with Parkinson’s disease: a 2 year follow up. J Neurol Neurosurg Psychiatry. 2001;71(4):493-498.
8. Ramig LO, Sapir S, Fox C, Countryman S. Changes in vocal loudness following intensive voice treatment (LSVT®) in individuals with Parkinson’s disease: A comparison with untreated patients and normal age‐ matched controls. Mov Disord. 2001;16(1):79-83.
9. de Swart BJ, Willemse SC, Maassen BA, Horstink MW. Improvement of voicing in patients with Parkinson’s disease by speech therapy. Neurology. 2003;60(3):498-500.
10. Nijkrake MJ, Keus SH, Kalf JG, Sturkenboom IH, Munneke M, et al. Allied health care interventions and complementary therapies in Parkinson’s disease. Parkinsonism Relat Disord. 2007;13:S488-S494.
11. Levitt JS, Chitnis S, Walker-Batson D. The Effects of the “SPEAK OUT!®” voice program for Parkinson’s disease. International Journal of Health Sciences. 2015;3:(2):13-19.
12. Mollaei F, Shiller DM, Gracco VL. Sensorimotor adaptation of speech in Parkinson’s disease. Movement Disorders. 2013;28(12):1668-1674.
13. Levitt JS. A case study: The effects of the ““SPEAK OUT!®” voice program for Parkinson’s Disease. International J Appl Sci Technology. 2014;4(2)20‐28.
14. Stemple JC, Roy N, Klaben BK. Clinical voice pathology: Theory and management. Plural Publishing. 2014.
15. Awan SN, Giovinco A, Owens J. Effects of vocal intensity and vowel type on cepstral analysis of voice. J voice. 2012;26(5):670 e15-70 e20.
16. Boersma P. PRAAT, a system for doing phonetics by computer. Glot International. 2001; 5(9/10):341-345.
17. Maryn Y, Weenink D. Objective dysphonia measures in the program Praat: smoothed cepstral peak prominence and acoustic voice quality index. J Voice. 2015;29(1):35-43.
18. Maryn Y, Corthals, P, Van Cauwenberge P, Roy N, De Bodt M. Toward improved ecological validity in the acoustic measurement of overall voice quality: combining continuous speech and sustained vowels. J Voice. 2010;24(5):540-555.
19. Barsties B, Maryn Y. The improvement of internal consistency of the Acoustic Voice Quality Index. Am J Otolaryngol. 2015;36(5):647-656.
20. Barsties B, Maryn Y. External validation of the Acoustic Voice Quality Index version 03.01 with extended representativity. Ann Otol Rhinol Laryngol. 2016;125(7):571-583.
21. Maryn, Y, De Bodt, M, Barsties, B, Roy N. The value of the Acoustic Voice Quality Index as a measure of dysphonia severity in subjects speaking different languages. Eur Arch Otorhinolaryngol. 2014;271(6):1609- 1619.
22. Fairbanks G. The rainbow passage. Voice and articulation drillbook. 2nd ed. New York: Harper and Row. 1960; pp124-139.
23. Hoehn MM, Yahr MD. Parkinsonism onset, progression, and mortality. Neurology. 1967;17(5):427-427.
24. American Speech-Language-Hearing Association. Consensus Auditory-Perceptual Evaluation of Voice (CAPE-V). ROCKVILLE, MD. 2002.
25. Zraick RI, Kempster GB, Connor NP, Thibeault S, Klaben BK, et al. Establishing validity of the consensus auditory-perceptual evaluation of voice (CAPE-V). Am J Speech-Lang Pathol. 2011;20 (1):14-22.
26. Jadad AR, Moore RA, Carroll D, Jenkinson C, Reynolds DJM, et al. Assessing the quality of reports of randomized clinical trials: Is blinding necessary? Control Clin Trials. 1996;17(1):1-12.
27. Hogikyan ND, Sethuraman G. Validation of an instrument to measure voice-related quality of life (V-RQOL). J Voice. 1999;13(4):557-569.
28. DeVellis RF. Scale development theory and application. Thousand Oaks. 3rd ed. CA: Sage Publications. 2003; Vol. 26.
29. Kline T. Psychological testing: A practical approach to design and evaluation. Sage, 2005.
30. Kent R. The Speech Sciences. San Diego: Singular Publishing Group. 1997.
31. Levitt JS, Katz WF. Augmented visual feedback in second language learning: Training Japanese post-alveolar flaps to American English speakers. Proc. Mtgs. Acoust. 2007;2(1):060002.
32. Kaipa R, Kaipa MR. Role of Constant, Random and Blocked Practice in an Electromyography-Based Oral Motor Learning Task. J Mot Behav. 2017;19:1-15.