The Correlation Between Lifetime Smoking and Ethnicity in People Who Smoke: A Study of Vocal Characteristics
Marewa Gloverl and Marie-France Duhamel*
lCentre of Research Excellence: Indigenous Sovereignty and Smoking, Auckland, New Zealand
KEYWORDS
Voice characteristics; Tobacco smoking; Laryngeal; Respiratory diseases
ABBREVIATIONS
NHR: Noise-to-Harmonics Ratio
HNR: Harmonic to Noise Ratio
NZ: New Zealand
ABSTRACT
Smoking is associated with deterioration of voice health. Detection of deterioration of voice characteristics can be an early indicator of smoking-related laryngeal and lower respiratory diseases. This study aimed to determine if voice characteristics could be used to differentiate demographics and years smoking among a diverse group of adults who smoke. Audio recordings were collected from fifty-nine adults aged 19-81 who currently smoked tobacco. Audio samples and a range of vocal measurements were analysed by gender, age, ethnicity, and number of years smoked. Age, a proxy for years smoked, was not a significant factor in determining the vocal parameters used in this study. Gender had some influence on voice quality, specifically in measurements of fundamental frequency, formant 4 and jitter. There was a correlation between ethnicity and vocal parameters for shimmer. Higher shimmer and noise-toharmonic ratio values were found in smartphone-recorded audio samples. Ethnicity appeared to be a stronger proxy for years smoked than age. Historically higher tobacco consumption among the Indigenous Māori people of New Zealand could be one explanation for this. Variation caused by the type of recording method may be important for informing the development of remote mHealth electronic diagnostic voice quality apps or devices.
INTRODUCTION
Years of persistent smoking can cause changes in the laryngeal area and structures some of which can result in health defects including chronic inflammatory changes. Smoking can cause sinusitis, gastroesophageal disease, and respiratory diseases such as emphysema, bronchitis, and cancer [1-3]. Deterioration of voice health has been associated with tobacco smoking [4]. Cigarette smoke irritates the lining of the larynx which can cause dehydration thereby affecting the free vibration of the vocal folds [5]. Byeon [6] proposed that consumption by duration of smoking partly determines the degree of voice deterioration, but longitudinal studies are needed to confirm this.
The development of early diagnostic tools, especially tools and mobile apps that enable individuals to monitor their own health is a burgeoning field [7], as in the domain of voice technologies [8]. There could be many uses for detection of voice deterioration in people who smoke. Such a measurement could indicate the need for assessment of smoking-related laryngeal and respiratory diseases. However, most studies published in 2000-2018 on the effect of smoking on voice quality were cross-sectional and compared groups of adults who smoked with adults who had never smoked [9]. These studies established that people who smoked experienced greater deterioration than people who had not smoked. To advance development of voice deterioration diagnostic apps for people who smoke, more information is needed to account for variance associated with age, sex, years smoking, occupation and potentially ethnicity. Occupations involving intensive use of the voice have also been associated with voice deterioration [10].
A further potential use of remote detection of voice deterioration could be to indicate if a person has stopped smoking. Research assessing smoking cessation efficacy has been hampered by the lack of a cost-efficient tool for validating smoking status remotely for example when testing mHealth interventions [11] or in low-income countries with scant funding for research, let alone costly collateral, such as biochemical, validation tools. One study that we know of set out to determine if changes in voice characteristics could be used to verify a change in smoking status, but a lab error prevented analysis of the data [12]. The increased need to reduce healthcare costs and increase access to equitable healthcare for people living in remote or underserved populations [13] provides a rationale for exploring this idea again.
This study aimed to identify if voice characteristics that could indicate deterioration differed by years smoked, age, gender and ethnicity.
MATERIALS AND METHODS
Research Design
This cross-sectional study investigates the vocal characteristics of adults who currently smoked differentiated by sex, age, ethnicity, and years smoked
Participants
Participants were 62 New Zealand (NZ) adults aged from 19 to 81 taking part in a qualitative 4-year longitudinal study of people who at enrolment (during June 2020 - March 2021) smoked tobacco and had no intention to stop smoking, or they believed they would be unable to stop smoking, by 2025. The Voices of the 5% Study (https://voicesofthe5percent.nz/home) [14] aimed to build understanding of the facilitators and barriers to smoking cessation among this group in the context of increasingly intensive Government and public health interventions to reach a smoking prevalence of 5% or below by 2025. Advertisements for participants were placed in NZ print and online media, on social media, and notices were distributed to the researchers’ and research Centre’s networks for distribution. A snowball method was also used whereby enrolled participants were asked to send the study advert on to people they knew who might be eligible. A sampling frame guided recruitment ad placement to ensure that a demographically diverse group of adults (across ethnicity, age and gender) were recruited, and that Māori (the Indigenous people of NZ) were oversampled. Māori were over-sampled due to a disproportionately high inequity in smoking rates by ethnicity in the country. Potentially eligible respondents who expressed an interest in enrolling in the study were sent a participant information sheet and consent form by email or post. This explained the purpose of the study, what participants would be asked to do, who was conducting it, and who was funding the study, and provided details on how their identity would be protected. Participants who signed the informed consent form were enrolled in the study.
Data Collection
Data for the broader study was collected via naturalistic semi-structured phone interviews. Demographic infor- mation collected included age, sex, gender, ethnicity and occupation. Smoking history questions included age of initiation, current smoking and duration of any past stop smoking attempts.
In a previous feasibility study [15] we found that sound signals recorded with smartphones amplified the pertur- bations detected in acoustic characteristic of voice, in comparison with signals recorded with an audio recorder, but that smartphone-recorded audio signals were of sufficient quality to be analysed with the Praat software. Thus, for this ancillary study audio samples were extracted from two sources: a) audio-recorded phone interviews conducted at baseline, or the next sufficiently audible recording, and b) self-recorded audio samples collected from a sub-group of participants. For the self-recorded audio samples, an Evistr Voice Recorder and task instructions were sent by courier to the home address of most participants. When prepared as instructed, participants recorded themselves reading a supplied text, the Rainbow Passage [16]. An addressed courier bag was supplied for participants to return the recorder to the study centre.
Measures
The software Praat version 6.1.42 [17] was used to analyse the audio samples. Praat is open-source software used for the analysis of speech in phonetics. Praat enables researchers to edit and analyse speech and other sounds to determine intensity, pitch height, duration, and formants.
Using Praat, the /a/ sound segment was manually isolated, and analysis functions were used to produce the follow- ing values: fundamental frequency, formants 3 and 4, jitter, shimmer, and noise/harmonic ratios.
The selection process of the audio sample used to measure participants’ acoustic characteristics was as follows:
• Preference was given to the sound signals that were recorded with an audio recorder by the partici- pants themselves in the two initial readings of a passage and during a single session. Vocal parameters were measured with PRAAT for a sound signal extracted from each of the two readings. For each vocal parameter we retained the mean value of the two readings. The audio samples of 34 participants fell into this category.
• We had no recorded reading for the remaining 25 participants and we used audio segments extracted from their phone-recorded initial interview. The acoustic characteristics used in this study for these 25 participants were the values of the vocal parameters measured for these phone-recorded sound signals.
Acoustic Parameters
The vocal parameters measured included:
• Fundamental frequency (F0): the number of oscillations per second at which the vocal cords vibrate,
•Formants F3 and F4: the resonant frequencies of the vocal tract
•Jitter parameters: perturbations in the frequency of the sound signal,
• Shimmer parameters: the amount of variation in amplitude of the fundamental frequency, and
•Noise: the noise-to-harmonic ratio (NHR), which detects the presence of noise in the sound signal, and the harmonic-to-noise ratio (HNR), which reflects the efficiency of speech.
Fundamental Frequency F0
The values of the fundamental frequency, in hertz, were expected to be influenced by the age and sex of the participants, and to be higher for women than men. This frequency also especially affects women who smoke, even among women who had smoked for 10 years or less [18,19]. Two of our participants were non-binary and at different stages in following a hormonal treatment that was likely to affect their vocal fundamental frequency.
Formants F3 and F4
The values of F3 and F4 formant frequencies, in hertz, were expected to be lower for men than women. The presence of smoking decreases their values [20].
Jitter and Shimmer
Smoking has been reported to increase jitter and shimmer values [20-22].
The jitter values included the relative period-to-period variability of the pitch period jitter (%), the absolute pe- riod-to-period difference in μs, the relative average perturbation (rap), and the pitch perturbation quotient within 5 periods (ppq5).
The shimmer values included its relative evaluation of cycle-to-cycle variability of amplitude shimmer (%), its cycle-to-cycle difference in decibels, the amplitude perturbation quotient over 3 periods (apq3), and the amplitude perturbation quotient over 5 periods (apq5).
Noise
Smoking has been associated with an increase in the noise-to-harmonics ratio (NHR) [21], while it may decrease the harmonic-to-noise ratio (HNR) [23].
Statistical Analysis
Glover and Duhamel [15] found that participants’ age and years smoked influenced the value of their vocal parameters. Participants with a mean age under 40 showed less perturbation in acoustic parameters than was reported in previous studies of vocal parameters among people aged over 40 [20,21]. Based on our previous study, we used 40 years as a cut-off age to divide participants into two age groups: participants over 40 (n = 25) and those 40 and under (n = 34).
Early in the analysis of the current data we determined that participant’s age and years smoked were associated (Figure 1), thus only analysis of the possible influence of participant’s age on acoustic parameters was performed.
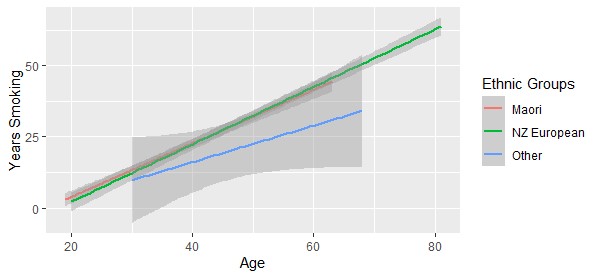
Figure 1: Years smoked by participant’s age for all ethnic groups.
Consumption of tobacco across ethnicities in NZ has varied by average age of initiation, tobacco consumption and years smoked [24,25]. We therefore organized individuals into three ethnic groups: the Māori Indigenous ethnic group (n = 25) included all individuals who self-identified as Māori or Māori and another ethnicity; NZ European (n = 28); and the remaining group of participants of Asian, Samoan, and Tongan ethnicities (n = 6).
The R function lm was used to model the effect of participant’s gender (male, female, non-binary), age group (less than or equal to 40, over 40), ethnic group (Māori, NZ European, other), and the type of recording equipment (audio recorder, smartphone) on the acoustic parameters. Anova function was used to determine the statistical significance of each of the four factors. The p-value measures the probability that the difference in means could have occurred by chance the lower the p-value, the greater the statistical significance of the factor’s influence on the acoustic parameter.
Availability of Data
The anonymised raw voice data is available from the author
RESULTS
Sixty-one participants submitted at least one baseline recording – either reading into an audio recorder or partici- pating in an interview on a smartphone. The sound recording of two participants presented no /a/ sound segment that could be extracted, and so for this study, one audio sample was able to be recovered for 59 participants.
Table 1 details distribution of participants by sex (two participants identified as non-binary), age, and years smoked.
| Participants | Number | Age range | Average age | Number, age <= 40 | Number, age > 40 | Average years smoked |
|---|---|---|---|---|---|---|
| Women | 35 | 20-81 | 43 | 21 | 14 | 24.5 |
| Men | 22 | 19-81 | 47 | 11 | 11 | 29 |
| Non-binary | 2 | 26-30 | 28 | 2 | 0 | 22 |
| All | 59 | 19-81 | 44 | 34 | 25 | 26 |
Table 1: Participants demographics at baseline: age and years smoked, distributed by sex of participants
Table 2 summarises distribution of participants by ethnicity, age, and years smoked. For all participants included in the Māori ethnic group, the average age and average years of smoking is shown.
| Participants | Number | Age range | Average age | Average years smoking | ||
|---|---|---|---|---|---|---|
| Māori | 17 | 24-63 | 38 | 35 | 21.5 | 18 |
| Māori/NZ European | 7 | 19-51 | 29 | 11 | ||
| Māori/Cook Island | 1 | 26 | 26 | 8 | ||
| NZ European | 28 | 20-81 | 51.5 | 34 | ||
| Asian | 2 | 38 | 38 | 12 | ||
| Samoan | 3 | 37-68 | 54.5 | 26 | ||
| Tongan | 1 | 30 | 30 | 14 | ||
| All | 59 | 19-81 | 44 | 26 | ||
Table 2: Participants demographics at baseline: age and years smoked, by ethnicity of participants.
The factors that revealed degrees of significance in association with vocal parameters measured with Praat are shown in Table 3. None of the factors we controlled for were selected for their impact on jitter ppq5 or HNR, and therefore these two acoustic parameters do not appear in Table 3.
The levels of the factors selected by the models for their statistically significant effect on vocal parameters are detailed in Table 4. We note that the gender factor was selected for its significant effect on F4 (as shown in Table 3), but no gender category was selected for its influence on F4 (Table 4). On the contrary, Table 4 shows that non-bi- nary gender is selected for its significant influence on three shimmer values (%, dB and apq3), although the gender factor itself is not statistically significant in association with these vocal parameters (Table 3).
| Vocal parameters | Factors | F value | Df | p-value | Significance |
|---|---|---|---|---|---|
| F0 (Hz) | gender | 13.967 | 2 | <0.001 | *** |
| recording equipment | 9.020 | 1 | <0.01 | ** | |
| Jitter (%) | gender | 2.970 | 2 | 0.0601 | tendency |
| Jitter (absolute, μs) | gender | 3.022 | 2 | 0.0573 | tendency |
| Jitter (rap, %) | gender | 6.120 | 2 | <0.01 | ** |
| Shimmer (%) | ethnic group | 4.177 | 2 | <0.05 | * |
| recording equipment | 2.995 | 1 | 0.0895 | tendency | |
| Shimmer (dB) | ethnic group | 3.543 | 2 | <0.05 | * |
| Shimmer (apq3, %) | recording equipment | 8.056 | 1 | <0.01 | ** |
| Shimmer (apq5, %) | recording equipment | 7.425 | 1 | <0.01 | ** |
| ethnic group | 5.127 | 2 | <0.01 | ** | |
| NHR | recording equipment | 3.078 | 1 | 0.0853 | tendency |
| F3 (Hz) | recording equipment | 40.354 | 1 | <0.001 | *** |
| age group | 2.854 | 1 | 0.0972 | tendency | |
| F4 (Hz) | recording equipment | 44.313 | 1 | <0.001 | *** |
| gender | 3.401 | 2 | <0.05 | * | |
| Df: Degree of freedom; the number of ‘*’ indicates the degree of significance | |||||
Table 3: F value, degree of freedom and p-value for the factors showing degrees of significance in association with the vocal parameters.
| Vocal parameters | Intercept/Factor levels | Estimate | Std Error | t-value | p-value |
|---|---|---|---|---|---|
| F0 (Hz) | Intercept | 167.838 | 10.376 | 16.175 | < 0.001 |
| Gender:Male | -49.858 | 0.999 | -5.540 | < 0.001 | |
| Equipment:Recorder | 27.424 | 9.468 | 2.897 | < 0.01 | |
| Jitter (%) | Intercept | 1.135 | 0.308 | 3.687 | < 0.001 |
| Gender:Non Binary | 1.873 | 0.754 | 2.486 | < 0.05 | |
| Jitter (absolute, μs) | Intercept | 83.251 | 26.299 | 3.165 | < 0.01 |
| Gender:Non Binary | 156.835 | 64.372 | 2.436 | < 0.05 | |
| Jitter (rap, %) | Intercept | 0.557 | 0.162 | 3.433 | < 0.01 |
| Gender:Non Binary | 1.307 | 0.397 | 3.289 | < 0.01 | |
| Shimmer (%) | Intercept | 8.601 | 1.331 | 6.462 | < 0.001 |
| Ethnicity:NZ European | -3.587 | 1.409 | -2.546 | < 0.05 | |
| Gender:Non Binary | 6.045 | 2.372 | 2.548 | < 0.05 | |
| Shimmer (dB) | Intercept | 0.765 | 0.125 | 6.129 | < 0.001 |
| Ethnicity:NZ European | -0.299 | 0.132 | -2.268 | < 0.05 | |
| Gender:Non Binary | 0.564 | 0.222 | 2.537 | < 0.05 | |
| Shimmer (apq3, %) | Intercept | 4.817 | 0.694 | 6.946 | < 0.001 |
| Equipment:Recorder | -1.247 | 0.463 | -2.692 | < 0.01 | |
| Ethnicity:NZ European | -2.156 | 0.738 | 2.922 | < 0.01 | |
| Gender:Non Binary | 3.099 | 1.235 | 2.509 | < 0.05 | |
| Shimmer (apq5, %) | Intercept | 6.167 | 0.978 | 6.303 | < 0.001 |
| Ethnicity:NZ European | -3.066 | 1.041 | -2.944 | < 0.01 | |
| Equipment:Recorder | -1.755 | 0.653 | -2.687 | < 0.01 | |
| F3 (Hz) | Intercept | 2961.67 | 150.51 | 19.678 | < 0.001 |
| Equipment:Recorder | 666.55 | 100.00 | 6.665 | < 0.001 | |
| F4 (Hz) | Intercept | 3080.54 | 109.60 | 28.107 | < 0.001 |
| Equipment:Recorder | 666.55 | 100.00 | 6.665 | < 0.001 |
Table 4: Coefficient estimate, standard error, t-value and p-value for the association between vocal parameters andfactor levels of significance.
DISCUSSION
Since the age of participants was associated with years smoked, we expected that age group would be selected for its influence on the vocal parameters. However, only formant 3 was correlated with the age group of participants, although this tendency was not statistically significant (p = 0.0972) and none of the two age groups was selected for its significance on this parameter (Table 4). Neither was age group selected for its influence on any other acoustic parameter.
Table 4 shows that the factors which displayed the strongest impact were:
•Gender, on F0, F4, and jitter values
•Ethnicity, on shimmer values
•Recording equipment, on all acoustic parameters but jitter
Regarding gender, there is a statistically significant negative correlation between male participants and F0, with a coefficient = -49.858 and p < 0.001 (Table 4). For F4 and jitter values, the gender level significance is due to the two non-binary participants who show a (non-significant) positive correlation with F4 with a coefficient = 174.69 and p = 0.518, and significant positive correlations for all three jitter values, as shown in Table 4: coefficient = 1.873 and p < 0.05 for Jitter %; coefficient = 156.835 and p < 0.05 for Jitter (absolute); coefficient = 1.307 and p < 0.01 for Jit- ter (rap). By excluding the two non-binary participants from the models, gender was not selected for its correlation with jitter or F4 values.
The correlation between ethnicity and vocal parameters observed for shimmer values was not expected. The NZ Eu- ropean group departed from the two other groups by showing significantly lower shimmer values, with coefficient= -3.587, p < 0.05 for shimmer (%); coefficient = -0.299, p < 0.05 for shimmer (dB); coefficient = -2.156, p < 0.01 for shimmer (apq3); and coefficient = -3.066, p < 0.01 for shimmer (apq5) (Table 4). The group of participants of Asian, Samoan, and Tongan ethnicities (n = 6) is both too small and disparate in terms of smoking history to interpret its shimmer values and so we will focus our discussion on the comparison of the two main ethnicity groups, NZ European and Māori.
In NZ, ethnicity could indicate tobacco consumption, that is the amount smoked over the years of smoking. Tobacco smoking and consumption among Māori has been disproportionately high compared to the NZ European population and Māori have historically had an early age of smoking initiation. Māori tobacco consumption per adult has followed a downward trend observed in NZ since the 1980s, but in 1981 it exceeded any OECD country. The consumption of tobacco among Māori was estimated at 4,766 grams per year in 1981 and 2,950 grams in 1996, which was nearly double the national average for consumption of tobacco, estimated at 2,905 grams in 1981 and 1,553 grams in 1996 [25]. Combined with the earlier age at which Māori individuals initiated smoking [24], tobacco consumption could explain the effect of ethnicity on shimmer vocal parameters. Despite Māori participants having a much lower mean age and years of smoking than their NZ European counterparts (i.e., mean age = 35 for the Māori participants and 51.5 for the NZ European participants; mean years smoking = 18 to 34), shimmer values recorded for Māori participants suggest higher perturbation than for NZ European participants.
Regarding the association between smoking and shimmer parameter, Pinto et al. [21] also noted the impact of the smoke-alcohol combination on thickening the epithelium of the vocal folds (revealed in Hirabayashi et al.’s study) [26]. This underlines the merit of considering the lifestyle of individuals for an appropriate application of their acoustic characteristics to health diagnoses.
Limitations
The novel focus on the detection of voice deterioration within a diverse group of adults who smoked was a strength, however the study does have some limitations.
The recording equipment (i.e., audio recorder versus smartphone) used to capture audio signals was included in our analysis to account for any influence on the demographic characteristics being measured. As shown in Table 3, recording equipment reported significant values in F0, F3, F4, and shimmer (apq3, apq5) for smartphone recorded audio. Improvements in smartphone technology may attenuate this effect with time. Still, the ability to analyse voice samples collected remotely via smartphone does hold promise for extending future voice diagnostic apps to underserved populations.
Occupation history of participants was not collected and thus was not included in the analysis. Ethnicity that was included in our analysis was based on participants’ self-identification. The identification New Zealand European can include people of European descent who were not born in NZ and similarly many people who identify as such also identify with one or more other ethnicities depending on their genealogy. Thus, our participants could have included people with diverse linguistic backgrounds, and this may have impacted some measures.
CONCLUSION
This study presents cross-sectional analysis of demographic variables in a diverse group of adults who currently smoked and explored whether voice characteristics indicative of voice deterioration differed by key demographics and years smoked. The study extends the existing literature which has mostly compared adults who smoke with adults who have never smoked [9].
The results support Fagherazzi et al.’s [8] conclusion that people’s diverse linguistic and cultural backgrounds need to be considered in the development of voice diagnostic technologies if they are to provide informed and relevant diagnoses. To do that we suggest that diagnostic and risk prediction tools measuring voice deterioration need finer smoking history detail including age of initiation and lifetime smoking consumption, that is, pack years smoked. In addition to established factors known to contribute to voice deterioration, such as occupation, ethnicity may need also to be considered. Although, the significance of ethnicity found in this study could be due the variance in smoking initiation and lifetime consumption by ethnicity in NZ.
The results provide information of value to the growing field of mHealth/eHealth diagnostic tools for early diagnosis of smoking-related harm. The raw data can also be added to future banks of samples that will need to be developed to enable more reliable estimates of voice deterioration as advocated by Fagherazzi et al., [8].
ACKNOWLEDGEMENTS
We are grateful to all of the Voices of the 5% Study participants, the study co-ordinator Emma Hurrell; and Professor Dennis Viehland for early review comments.
CONFLICT OF INTEREST DISCLOSURE STATEMENT
This study was conducted as part of a wider programme of research being undertaken by the Centre of Research Excellence: Indigenous Sovereignty & Smoking. The funding for that programme of work was obtained following submission of a researcher-initiated application for a funding grant (COE1-009) from the Foundation for a Smoke-Free World, Inc. (“FSFW”), a US non-profit 501(c)(3) private foundation. This study is, under the terms of the grant agreement with FSFW, editorially independent of FSFW. The contents, selection and presentation of facts, as well as any opinions expressed herein, are the sole responsibility of the authors and under no circumstances should they be regarded as reflecting the positions of FSFW.Neither the authors nor the Centre of Research Excellence: Indigenous Sovereignty & Smoking have any commercial interests in vaping, snus, oral nicotine or tobacco products. M.G. has, over 10 years ago, received fees from pharma- ceutical companies for consultancy re cessation medicines.
REFERENCES
1. Banjara H, Mungutwar V, Singh D, Gupta A. Objective and subjective evaluation of larynx in smokers and nonsmokers: a comparative study. Indian J. Otolaryngol. Head Neck Surg. 2014; 66(1): 99-109.
2. Guimarães I, Abberton E. Health and voice quality in smokers: An exploratory investigation. Logoped. Pho- niatr. Vocol. 2005;30(3-4):185-191.
3. Signal LN, Edwards R, Gage R, Jackson N, McKerchar C, et al. The state of cancer prevention in Aotearoa New Zealand: Slow progress requires political leadership and investment for health and equity. J. Cancer Policy. 2020:23:100212, 1-5.
4. Tafiadis D, Kosma EI, Chronopoulos SK, Papadopoulos A, Drosos K, et al. Voice Handicap Index and Interpre- tation of the Cutoff Points Using Receiver Operating Characteristic Curve as Screening for Young Adult Female Smokers. J. Voice. 2018;32(1):64-69.
5. Decoster W, Debruyne F. Longitudinal Voice Changes: Facts and Interpretation. J. Voice. 2000;14(2):184-193.
6. Byeon H. The association between lifetime cigarette smoking and dysphonia in the Korean general population: findings from a national survey. PeerJ. 2015;28;3:e912, 1-11.
7. Amagai S, Pila S, Kaat AJ, Nowinski CJ, Gershon RC. Challenges in Participant Engagement and Retention Using Mobile Health Apps: Literature Review. J. Med Internet Res. 2022;24(4): e35120, 1-12.
8. Fagherazzi G, Fischer A, Ismael M, Despotovic V. Voice for Health: The Use of Vocal Biomarkers from Research to Clinical Practice. Digit. Biomark. 2021;5(1):78-88.
9. Byeon H, Cha S. Evaluating the effects of smoking on the voice and subjective voice problems using a metaanalysis approach. Sci Rep. 2020;10(1):4720.
10. Jannetts S, Schaeffler F, Beck J,Cowen S. Assessing voice health using smartphones: Bias and random error of acoustic voice parameters captured by different smartphone types. Int J Lang Commun Disord. 2019;54(2),292–305.
11. Scott-Sheldon LAJ, Lantini R, Jennings EG, Thind H, Rosen RK, et al. Text Messaging-Based Interventions for Smoking Cessation: A Systematic Review and Meta-Analysis. JMIR mHealth uHealth. 2016;4(2) e49,1-24.
12. McRobbie H, Bullen C, Kasabov N, Lin RB, Pang S, et al. Evaluation of two novel methods to verify smoking status. In Health and Disability Ethics Northern Y Regional Ethics Committee Agenda, 25 January 2006. Retrieved 19 April 2022.
13. Witman MD, Anderson E, Carroll CB, Dark PM, Down K, et al. On behalf of the NIHR CRN INCLUDE Steering Group. (2020). Ensuring that COVID-19 research is inclusive: guidance from the NIHR INCLUDE project. BMJ Open. 2020;10:e043634, 1-6.
14. Centre of Research Excellence: Indigenous Sovereignty & Smoking. Voices of the 5%: A survey of people who smoke 2020-2025.
15. Glover M, Duhamel MF. Assessment of two audio-recording methods for remote collection of vocal biomarkers indicative of tobacco smoking harm. Acoustics Australia. In press.
16. Fairbanks G. Voice and Articulation Drillbook. 2nd edition. New York: Harper & Row; 1969.
17. Boersma P, Weenink D. Praat: doing phonetics by computer [Computer program]. Version v6.1.47. 2021.
18. Gonzalez J, Carpi A. Early effects of smoking on the voice: a multidimensional study. Med Sci Monit. 2004;10: CR649-CR656.
19. Tafiadis D, Toki EI, Ziavra N. Deviations of Voice Characteristics in Female Speech Therapy Students that Smoke Using Dr. Speech. J Commun Disorder Assist Technol. 2017;1:1-18.
20. Zealouk O, Satori H, Hamidi M, Laaidi N, Satori K. Vocal parameters analysis of smoker using Amazigh lan- guage. Int J Speech Technol. 2018;21: 85–91.
21. Pinto AG, Crespo AN, Mourão LF. Influence of smoking isolated and associated to multifactorial aspects in vocal acoustic parameters. Braz J Otorhinolaryngol. 2014;80:60-67.
22. Teixeira JP, Oliveira C, Lopes C. Vocal Acoustic Analysis - Jitter, Shimmer and HNR Parameters. Procedia Technology. 2013;9:1112-1122.
23. Tuhanioğlu B, Erkan SO, Özdaş T, Derici Ç, Tüzün K, et al. The effect of electronic cigarettes on voice quality. J Voice. 2019;33(5):1-5.
24. Gurram N, Martin G. Disparities in age of smoking initiation and transition to daily smoking in New Zea- land. Health Promotion Agency; 2019.
25. Laugesen M, Clements M. Cigarette smoking mortality among Māori, 1954 - 2028. Te Puni Kōkiri; Health New Zealand; 1998.
26. Hirabayashi H, Koshii K, Uno K, Ohgaki H, Nakasone Y, et al. Laryngeal epithelial changes on effects of smoking and drinking. Auris Nasus Larynx. 1990;17(2):105-14.