Parker CR*, and Reeves-Pelt R
1Department of Communicative Disorders, School of Public Health, Jackson State University, United States
2Speech-Language Pathologist, Spanish Meadows Nursing & Rehabilitation, United States
- *Corresponding author: Celeste R. Parker, Department of Communicative Disorders, School of Public Health, Jackson State University, Jackson, Tel: (601) 979-8877; Fax: (601) 432-6844, Email: celesterparker@yahoo.com
-
Article Details
Received: Dec 23, 2016; Accepted: March 04, 2017; Published: March 07, 2017
-
Competing Interests
The authors have declared that no competing interests exist.
-
Cite as:
Parker CR, Reeves-Pelt R. Listener Response to Dialect in Music: A Comparison of Speakers of African American Dialect and Nondialect
Speakers. J Commun Disorder Assist Technol. 2017; 1: 1-18. -
Creative Commons Attribution License
This article is distributed under the terms of the Creative Commons Attribution License, which permits unrestricted use and redistribution provided that the original author and source are credited.
-
Key Words
African American Vernacular English, Standard American English
Abstract
African American Vernacular English (AAVE) is considered a variation of Standard American English (SAE). Speakers of AAVE and SAE view the contrasting language differently. Both types of expressive language are found in music. The opinions regarding each are relevant to the perception of preference of one to the other. The purpose of this study was to investigate how listeners from different linguistic backgrounds respond to music with lyrics that have AAVE compared to the same song sung without dialectal features. The results revealed that overall the male AAVE speakers and female SAE speakers rated the AAVE version favorably. The female AAVE speakers and male SAE speakers least preferred the AAVE version. The male and female SAE speakers rated the SAE version favorably. These results were consistent with the researcher’s hypothesis that the SAE speakers would prefer the SAE version when compared to the AAVE speakers. However, the female AAVE speakers’ preference for the SAE version was not consistent with the researchers’ hypothesis. These results might be attributed to participants’ linguistic community.
INTRODUCTION
African American Vernacular English (AAVE) is one of the topics of debate in the field of speech-language pathology. AAVE is a form of American English primarily spoken by African Americans. According to Roseberry-McKibbon [1], AAVE dialect speakers may exhibit regional variation, but as a whole, particular patterns of omission, substitution, modification of verbs, metathetic production, devoicing and deletion of final consonants, diphthong reduction, and unstressed syllable deletion characterize AAVE. Traditionally, the speech-language pathologist’s role in speech development was to rectify speech and language impairments when indicated according to assessment batteries. However, through the years speakers within the country have begun using a variation of Standard American English. With this occurrence, speech-language pathologists have begun the difficult task of distinguishing between those who need treatment and other issues such as speaking an English variation or second language interference.
The origin of AAVE for its speakers begins with parents and family members who are native speakers of the language. According to Craig and Washington [2], when exploring the differences between African-American primary caregivers and their young children (aged 52-85 months) there were many similarities in the distribution of AAVE between these older and younger speakers, highlighting not only their kinship but also their membership in the same linguistic community.
As child speakers of AAVE become older the threat of misdiagnoses is a usual occurrence. Many times this occurs due to the phonologic features that are overlooked by those who are unfamiliar to AAVE speakers. Pollack and Hinton [3] stress the importance of transcription detail when differentiating dialect variation from phonological delay or disorder. In their study they note the type of transcription recommended for various AAVE phonological features: simple omission of consonant or vowel symbols, omission (or devoicing) of syllables or segments, but with modification of remaining sounds with diacritics for length or nasalization, simple substitution (or transportation) of consonant or vowel symbols, and modification of consonant or vowel symbols with diacritics. The problems with adequate diagnosis of language impairments in AAVE speakers are due to standardized tests. Therefore, some professionals in the field have been able to identify testing instruments, which
are appropriate for child speakers of AAVE. Smith et al. [4] investigated the sensitivity of the T-unit (minimal terminal unit) to determine if it provides a nonbiased alternative for assessing the oral grammatical skills of school age, nonstandard English speakers. T-unit is defined as a grammatical sentence containing one main clause and any attached or embedded clause or no clausal structure [4]. It measured the expressive language and syntax of fourteen AAVE speakers. The results indicated that the T-unit might be culturally fair dialectally nonbiased measure with which to assess the language abilities of school-age children.
Craig and Washington [5] investigated if performance of African American children with language impairments statistically differs from those of peers matched for chronological age or mean C-unit on selected expressive and receptive measures. C- Unit is defined as independent clauses plus their modifiers in the form of coordinate, subordinate, and embedded clauses [5]. They were measured on language comprehension, responses to active and passive sentences constructions, and answering WH questions. In addition, they were given a language sample analysis, which included average length of communication units (MCLU), frequency of complex syntax, and numbers of different words completed. The results revealed that these tests when combined were able to uncover children who had language delays.
Wilcox and Andersen [6] developed a testing instrument specifically geared towards AAVE speakers to ensure that children are not subjected to unwarranted treatment. In their research they selected sounds and clusters that are a part of the AAVE phonology. Each one was target in the same position twice in different words. The criteria was based upon the following: the sounds had been reported to differentiate between children who are AAVE-speakers with normal and disordered phonologies, they are expected to be used productively by children between the ages of 5;0-6;6, and they are part of AAVE phonology [6].
The attitudes of educators and SLPs toward the use of AAVE might be one reason that children who speak AAVE are subject to misidentification and unwarranted treatment. The opinions regarding the use of AAVE vary among age groups. Koch et al. [7] examined the African-American adults’ perceptions of those African-Americans who use Black English (BE), Standard English (SE) or code switch (CS) between the two languages. The subjects were exposed to an audiotape of a man speaking in BE, SE, appropriate CS, or inappropriate CS. The subjects were asked to rate the speaker according to the Revised Speech Dialect Attitudinal Scale. They were also asked whether or not they wanted to know or work with the speaker. The results indicated that the subjects rated the SE and appropriate CS model more favorably than either the BE or inappropriate CS. However, in a previous study conducted by Gross & Koch [8] they used the same procedure for children ages 12-16. The results indicated the complete opposite. The AAVE speakers were viewed more favorably than the SE speakers. This speaks to the changing society and social norms within the world.
AAVE has become a usual occurrence in the area of music. Many successful performers use AAVE within the lyrical content of their music. Both AAVE and SAE speakers have embraced this music. According to Mora [9] music and language share several features. Both stem from the processing of sounds. They are used by their speakers to convey a message. They have pitch, prominence, stress, tone, rhythm, and pause. Each is learned through experience. It also can be used as a motivating factor for productivity. Hicks [10] explored the effectiveness of rap music as a method of instruction for urban preschool children and found that 40 three-and – four old African-American and Hispanic children were motivated to practice more, and ultimately learned more names of unfamiliar body parts compared to a control group that received the same instruction without music.
According to Zoller [11] music can be in incorporated into speech therapy in a variety of forms. These applications include the use of music as a background to promote relaxation and guided imagery, the use of songs as a vehicle for verbal expression and language development, the use of movement coupled with songs, and the use of instruments by themselves or as an accompaniment for songs. The research of Hicks [10] suggested use of rap music increased the effectiveness of instruction. This raises the interesting possibility of incorporating rap and other forms of music that feature AAVE into speech therapy activities.
Research has shown that music can be an important component of instruction and speech therapy [10,11]. However, before we implement therapy activities using rap or other forms of music, we need more information about how listeners respond to dialect features in such music.
The purpose of this research was to investigate the responses of listeners from different linguistic backgrounds to music lyrics that have African American dialect present and lyrics with no dialectal features. The participants were Black and White, male and female dialect speakers and nondialect speakers (i.e., speakers of AAVE and SAE). This research is important because there is a lack of studies on adult listeners’ responses to dialectal features, particularly when those features are presented in music.
METHODS
Participants
The participants for this study included five Black males, five White males, five Black females, and five White females. All of the participants were recruited from the University of Northern Iowa’s student population. The participants in the Black male group ranged in age from 19–25 with a mean age of 21.6, and those in the White male group ranged in age from 21–22 with a mean age of 21.6. The participants in the Black female group ranged in age from 20–23 with a mean age of 21.2, and those in the White female group ranged in age from 18–21 with a mean age of 19.4. The researchers initially attempted to recruit potential participants through the use of flyers distributed at Maucker Union and the Wellness/Recreation Center, both located on the University of Northern Iowa campus. This strategy proved to be unsuccessful. Therefore, verbal requests were initiated at St. Stephen the Witness Catholic Student Center, which resulted in identifying some participants who matched the criteria needed for the study. To identify the desired number of AAVE speakers, a snowball sampling approach was implemented [12]. For SAE speakers, announcements were made at the Wednesday night Primetime Mass at St. Stephen the Witness Catholic Student Center. A church-affiliated group was chosen because of the use of gospel music in the study. The location helped eliminate many participants unaware of this genre of music.
All potential participants completed a questionnaire, which provided information about their cultural and linguistic background, academic major, and preferences and familiarity with certain forms of music (see Appendix A). Potential candidates were chosen based upon their responses to the questionnaire. The criteria used in the selection were the following: affiliated with a religious sect, lifelong resident of the midwestern United States, and aged 18–25. Participants varied in their exposure to different musical genres. Preferences included Gospel, Rhythm and blues (R&B), Pop, and Country music.
Procedures
Each participant was tested at his or her convenience. Therefore, testing was conducted at the participant’s residence or in groups at St. Stephen the Witness Catholic Student Center. Each participant listened to two audio taped performances of a twenty-five year old, African American, professionally trained female vocalist’s operatic rendition of a Negro spiritual entitled, “When I Get Home” (written and arranged by Edward Boatner). The vocalist, who was born and raised in south Louisiana, possessed a bachelor’s degree in music performance and a master’s degree in music business. She was trained in New Orleans, LA and Chicago, IL. The first performance of the spiritual was in AAVE and the second in SAE. The lyrics for each version of the spiritual are given in Appendix B. After each version was finished, the participants were asked rate the song’s lyrics according to the scale. Each participant completed a rating scale, consisting of 10 bipolar adjectives: harmonious–unharmonious, tasteful–distasteful, pleasant–unpleasant, soothing–harsh, desirable–undesirable, appealing–unappealing, sophisticated–unsophisticated, enjoyable–unenjoyable, relaxing–unrelaxing, and delightful–undelightful. Participants rated each adjective on a 7-point scale, from +3 at the positive end of the spectrum to 0 at the middle, to ¬¬–3 at the negative end, which assessed their reactions to the performance.
Ratings of Each Bipolar Adjective Pair
The listeners’ ratings of each bipolar adjective pair are illustrated in Figures 1–4 for the AAVE and SAE versions of the spiritual. In these figures the results are displayed in the original 7-point scale (–3 to +3). The group responses are described below.
Pair 1: Harmonious–unharmonious. Male AAVE speakers rated the AAVE version the highest among the groups (M = 1.4, range 0 to 2) followed by female AAVE speakers (M = 1.0, range –2 to 2). Female AAVE speakers rated the SAE version the highest among the groups (M = 2, range of 0 to 3), followed by female SAE speakers (M = 1.4, range of 1 to 3).
Pair 2: Tasteful–distasteful. Male SAE speakers rated the AAVE version the highest among the groups (M = 1.4, range of 0 to 3). Male ASE speakers rated the SAE version the highest among the groups (M = 2, range of 1 to 3), followed by female ASE speakers (M = 1.4, range of 0 to 3).
Pair 3: Pleasant–unpleasant. Male AAVE speakers rated the AAVE version the highest among the groups, (M = 0.8, range of 0 to 3), followed by female SAE speakers (M = 0.6, range of –1 to 2). Female AAVE speakers rated the SAE version the highest amongst the groups (M = 1.4, range from 0 to 3), followed by female SAE speakers (M = 1.2, range of –1 to 3).
Pair 4: Soothing–harsh. Male AAVE speakers rated the AAVE version the highest among the groups (M = 1.4, range of 0 to 3). Female AAVE speakers rated the SAE version the highest among the groups (M = 1.6, range of –1 to 3), followed by female SAE speakers (M = 1.4, range of –1 to 3).
Pair 5: Desirable–undesirable. Female SAE speakers rated the AAVE version the highest among the groups (M = 0.2, range of –2 to 2). Male SAE speakers rated the SAE version the highest among the groups (M = 1.2, range of 0 to 3), followed by female SAE speakers (M = 0.8, range of –2 to 3).
Pair 6: Appealing–unappealing. Female SAE speakers rated the AAVE version the highest among the groups (M = 0.6, range of –1 to 3), followed by male AAVE speakers (M = 0.2, range of –1 to 1). Female SAE speakers rated the SAE version the highest among the groups (M = 1.4, range of –1 to 3), followed by male SAE speakers (M = 1.2, range of –1 to 3).
Pair 7: Sophisticated–unsophisticated. Male SAE speakers rated the AAVE version the highest among the groups, (M = 2, range of 3 to 1), followed by male AAVE speakers (M = 1.4, range –1 to 3). Male SAE speakers rated the SAE version the highest among the groups, (M = 1.8, range of 0 to 3), followed by female AAVE speakers (M = 1.6, range of –1 to 3).
Pair 8: Enjoyable–unenjoyable. Female SAE speakers rated the AAVE version the highest among the groups (M = 0.4, range of –1 to 3), followed by male AAVE speakers (M = 0.2, range of –1 to 1). Male SAE speakers rated the SAE version the highest among the groups (M = 1.4, range of –1 to 3), followed by female SAE speakers (M = 1.2, range of –1 to 3).
Pair 9: Relaxing–unrelaxing. Male AAVE speakers rated the AAVE version the highest among the groups (M = 1) despite a wide range of ratings (–3 to 3). Female SAE speakers rated the SAE version the highest among the groups (M = 1.4, range of –1 to 3).
Pair 10: Delightful–undelightful. Male AAVE speakers rated the AAVE version the highest among the groups (M = 0.6, range of –1 to 3), followed by female SAE speakers (M = 0.2, range of –1 to 3) and male SAE speakers (M = 0.2, range of –1 to 1). Female SAE speakers rated the SAE version the highest among the groups (M = 1.2, range of –1 to 3), followed by male SAE speakers (M = 1, range of 0 to 2).
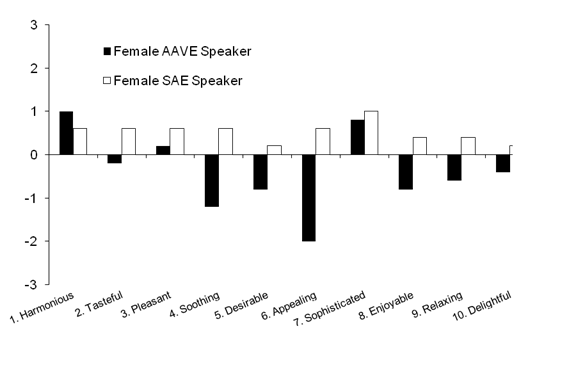
Figure 1: Ratings of the AAVE version of the song by female participants. AAVE = African American Vernacular English; SAE = Standard American English
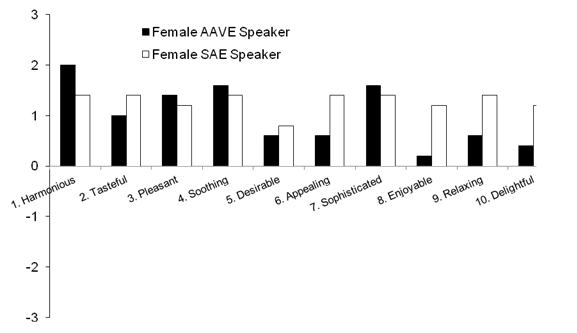
Figure 2: Ratings of the AAVE version of the song by male participants. AAVE = African American Vernacular English; SAE = Standard American English.

Figure 3: Ratings of the SAE version of the song by female participants. AAVE = African American Vernacular English; SAE = Standard American English.
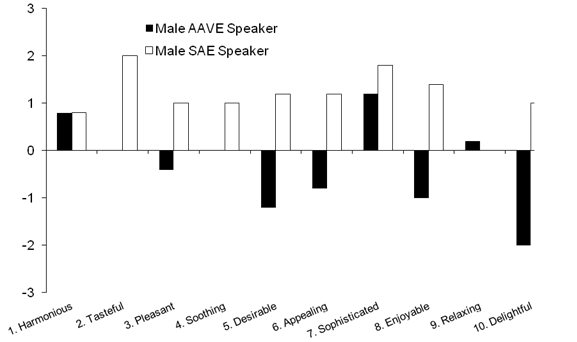
Figure 4: Ratings of the SAE version of the song by male participants. AAVE = African American Vernacular English; SAE = Standard American English.
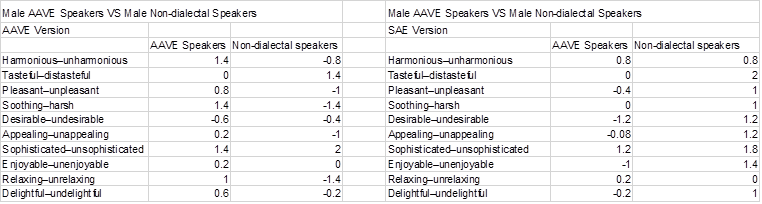
Chart 1: Listeners’ ratings of each bipolar adjective pair
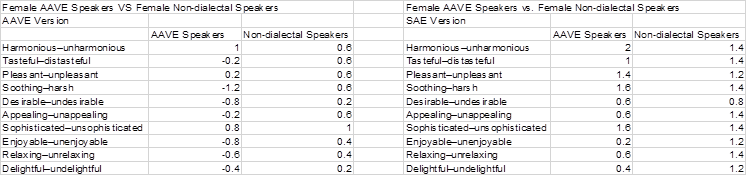
Chart 2: Listeners’ ratings of each bipolar adjective pair
Preliminary
Analysis A preliminary analysis was conducted to determine the extent to which participant ratings of the bipolar adjectives were independent or related. A high degree of correlation among ratings would be evidence that listeners were expressing a generally favorable or unfavorable reaction rather than independent reactions to each of the 10 adjective pairs. To complete this analysis, the original 7-point scale that ranged from –3 to +3 was converted to a 1–7 scale by adding 4 points to each response. This eliminated negative numbers but did not affect the relative ratings for any of the bipolar adjectives. Spearman rank-order correlation coefficients were computed among the bipolar adjective pairs for the AAVE and SAE versions of the spiritual. The results for the AAVE version are shown in Table 1, and the results for the SAE version are shown in Table 2.
| 1 | 2 | 3 | 4 | 5 | 6 | 7 | 8 | 9 | 10 | |
| 1 | 1.00 | |||||||||
| 2 | –0.17 | 1.00 | ||||||||
| 3 | 0.73** | 0.03 | 1.00 | |||||||
| 4 | 0.48* | –0.14 | 0.79** | 1.00 | ||||||
| 5 | 0.14 | 0.54** | 0.51* | 0.38 | 1.00 | |||||
| 6 | 0.64** | –0.01 | 0.84** | 0.66** | 0.43* | 1.00 | ||||
| 7 | 0.28 | 0.56** | 0.45* | 0.22 | 0.60** | 0.58** | 1.00 | |||
| 8 | 0.61** | 0.15 | 0.79** | 0.83** | 0.49* | 0.77** | 0.42* | 1.00 | ||
| 9 | 0.67** | 0.07 | 0.72** | 0.80** | 0.39* | 0.65** | 0.34 | 0.89** | 1.00 | |
| 10 | 0.27 | 0.21 | 0.36 | 0.47* | 0.42* | 0.24 | 0.20 | 0.62** | 0.62** | 1.00 |
*p < .05. **p < .01 Table 1: Correlations Among Bipolar Adjective Pairs for the African American Vernacular English Version
The correlation analysis for the AAVE version revealed significant correlations for 29 of 45 comparisons, of which 20 were significant at the p < .01 level and 9 at the p < .05 level. The analysis for the SAE version revealed significant correlations for 36 of 45 comparisons, of which 32 were significant at the p < .01 level and 4 at the p < .05 level. The amount of intercorrelation varied depending on the particular adjective pair. For example, the analysis revealed only two significant correlations for the second adjective pair, tasteful–distasteful, when listeners were rating the AAVE version, and no significant correlations for the first adjective pair, harmonious–unharmonious, when listeners were rating the SAE version. [/mp_code] [/mp_span] [/mp_row] [mp_row] [mp_span col="12"] [mp_code]
| 1 | 2 | 3 | 4 | 5 | 6 | 7 | 8 | 9 | 10 | |
| 1 | 1.00 | |||||||||
| 2 | 0.02 | 1.00 | ||||||||
| 3 | 0.26 | 0.72** | 1.00 | |||||||
| 4 | 0.30 | 0.61** | 0.80** | 1.00 | ||||||
| 5 | –0.04 | 0.80** | 0.86** | 0.69** | 1.00 | |||||
| 6 | 0.14 | 0.82** | 0.81** | 0.57** | 0.85** | 1.00 | ||||
| 7 | 0.18 | 0.78** | 0.78** | 0.50* | 0.67** | 0.76** | 1.00 | |||
| 8 | 0.15 | 0.75** | 0.82** | 0.71** | 0.90** | 0.89** | 0.62** | 1.00 | ||
| 9 | 0.27 | 0.49* | 0.69** | 0.69** | 0.52* | 0.56** | 0.46* | 0.61** | 1.00 | |
| 10 | 0.30 | 0.75** | 0.83** | 0.73** | 0.75** | 0.79** | 0.77** | 0.88** | 0.74** | 1.00 |
*p < .05. **p < .01 Table 2: Correlations Among Bipolar Adjective Pairs for the Standard American English Version
Comparing the AAVE and SAE Versions
When exploring differences across multiple, correlated dependent variables, represented in the present study by listener ratings on 10 bipolar adjectives, the ideal analysis is a multivariate analysis of variance [13]. However, such an analysis was not feasible in the present study due to the small number of participants. As an alternative, a composite variable was generated that consisted of the mean rating across all 10 bipolar adjectives for each listener. A second composite variable was generated that consisted of the mean rating across the five bipolar adjectives that exhibited the most intercorrelation in both the AAVE and SAE versions: Pair 3, pleasant–unpleasant; Pair 4, soothing–harsh; Pair 6, appealing–unappealing; Pair 8, enjoyable–unenjoyable; and Pair 9, relaxing–unrelaxing. The results for each group are shown in Tables 3 and 4.
| Group | AAVE | SAE | |||||||
| M | Mdn | SD | Range | M | Mdn | SD | Range | ||
| Female AAVE speakers | 3.78 | 4.0 | 0.87 | 2.3–4.5 | 5.00 | 4.7 | 0.81 | 4.1–6.0 | |
| Female SAE speakers | 4.52 | 4.5 | 1.40 | 3.1–6.3 | 5.28 | 5.2 | 1.47 | 3.2–7.0 | |
| Male AAVE speakers | 4.60 | 4.4 | 1.00 | 3.3–5.6 | 3.98 | 4.3 | 1.99 | 1.6–6.3 | |
| Male SAE speakers | 3.64 | 3.6 | 0.59 | 3.0–4.6 | 5.22 | 5.3 | 0.87 | 4.1–6.4 | |
Note. Scored on a scale of 1–7, with 1 representing the most negative response
Table 3: Summary Statistics for Ratings of the African American Vernacular English (AAVE) and Standard American English (SAE) Versions: Composite of 10 Bipolar Adjective Pairs
The results shown in Table 3 indicated that both the female AAVE and female SAE groups rated the SAE version of the spiritual higher than the AAVE version. Although the female SAE speakers rated the SAE version higher, their rating of the AAVE version was the second highest among the four groups. The male listeners rated the two versions differently. The male AAVE group rated the AAVE version higher than the SAE version. The male SAE group rated the SAE version higher. The pattern of results remained the same when only five bipolar adjectives were included in the composite, as shown in Table 4.
These results were analyzed using a three-way mixed-model analysis of variance. The between-group factors were the gender and dialect of the listeners. The repeated measure was the version of the spiritual (AAVE or SAE). The analysis revealed no significant differences for gender, F(1, 16) = 0.35, p > .05, or dialect, F(1, 16) = 0.45, p > .05. There was no significant interaction between gender and dialect, F(1, 16) = 0.15, p > .05, no significant interaction between gender and version of the spiritual, F(1, 16) = 1.10, p > .05, and no significant interaction between dialect and version of the spiritual, F(1, 16) = 3.19, p > .05. However, the analysis did reveal a significant difference for version of the spiritual, F(1, 16) = 9.11, p < .01, and a significant three-way interaction among gender, dialect and version of the spiritual, F(1, 16) = 7.48, p < .02. Across all four listener groups, the participants rated the SAE version higher than the AAVE version. Examination of the group means suggested that the three-way interaction was related to the different ratings by the male speakers of AAVE, the only group who rated the AAVE version of the spiritual higher than the SAE version. [/mp_code] [/mp_span] [/mp_row] [mp_row] [mp_span col="12"] [mp_code]
| Group | AAVE | SAE | |||||||
| M | Mdn | SD | Range | M | Mdn | SD | Range | ||
| Female AAVE speakers | 3.48 | 3.4 | 1.07 | 1.8–4.6 | 4.88 | 4.6 | 0.98 | 3.6–6.2 | |
| Female SAE speakers | 4.52 | 4.6 | 1.42 | 3.0–6.2 | 5.32 | 5.4 | 1.55 | 3.0–7.0 | |
| Male AAVE speakers | 4.71 | 4.4 | 1.25 | 3.2–6.2 | 3.60 | 4.2 | 2.31 | 1.0–6.2 | |
| Male SAE speakers | 2.92 | 2.8 | 0.78 | 2.2–4.2 | 5.04 | 4.8 | 1.22 | 3.4–6.6 | |
Note. Scored on a scale of 1–7, with 1 representing the most negative response. Five bipolar adjective pairs were those with the most intercorrelation in both the AAVE and SAE versions: pleasant–unpleasant, soothing–harsh, appealing–unappealing, enjoyable–unenjoyable, and relaxing–unrelaxing.
Table 4: Summary Statistics for Ratings of the African American Vernacular English (AAVE) and Standard American English (SAE) Versions: Composite of Five Bipolar Adjective Pairs
The analysis of variance was repeated with a second composite variable that included only the five most highly correlated adjective pairs. The outcome of this second analysis was similar, yielding no significant differences for gender, F(1, 16) = 0.76, p > .05, or dialect, F(1, 16) = 0.26, p > .05. There was no significant interaction between gender and dialect, F(1, 16) = 0.70, p > .05, and between gender and version of the spiritual, F(1, 16) = .32, p > .05. There was a significant difference for version of the spiritual, F(1, 16) = 7.57, p < .02; significant interaction between dialect and version of the spiritual, F(1, 16) = 4.36, p < .04; and a significant threeway interaction among gender, dialect, and version of the spiritual, F(1, 16) = 10.90, p < .01. Across all groups, the listeners rated the SAE version higher than the AAVE version. Further, the male and female SAE speakers rated the SAE version higher compared to the male and female AAVE speakers. However, the dialect trend did not apply to the AAVE version. The female SAE speakers and male AAVE speakers rated the AAVE version higher compared to the other two groups. Again, the three-way interaction appeared to be related to the different ratings of the male AAVE speakers, the only group to rate the AAVE version higher than the SAE version. DISCUSSION
The purpose of this study was to investigate the appreciation of music containing AAVE and SAE, when presented to speakers of AAVE in comparison to SAE speakers. In particular, the study focused on listener preference toward AAVE and SAE in relation to gender and type of English spoken.
Findings and Implications
Overall, the SAE version was rated more favorably by the listeners. Conversely, the male AAVE speakers rated the AAVE version higher than the SAE version. The female SAE speakers rated the AAVE with the second highest rating. The AAVE version was the least preferred by the female AAVE and male SAE speakers. Therefore, the participants’ ratings of the two versions were not consistent with their dialectal backgrounds.
One possible explanation for the female AAVE speakers’ response is their native communities. These participants were Iowa natives. According to the U.S. Census Bureau [14], African Americans comprise 2.2% of the total population in the state. With the given statistics it is quite possible that the female AAVE speakers are usually immersed in SAE environments. As a result, their avid use and interaction with AAVE is not a very frequent occurrence. The male AAVE speakers were natives of communities outside of the state of Iowa. These were more urban communities in which the percentage of AAVE speakers would be higher than in the state of Iowa. Therefore, their interaction with other minorities and AAVE speakers most likely occurred at a greater frequency than their female counterparts. Probable differences in culture and linguistic experience could explain the results from the male AAVE participants, who had more intense exposure to the language. The female AAVE speakers’ ratings could indicate that their lack of exposure to the vernacular determined their preferences.
Moreover, there were differences in the responses given by male and female SAE speakers. The male SAE speakers rated the AAVE version the lowest of all the groups. However, the female SAE speakers rated the AAVE version moderately high. One possible explanation for this difference is that male SAE speakers have not embraced AAVE as an adequate variation of English and therefore do not favor this type of speech. The female SAE speakers might have rated the version favorably due to their exposure to different forms of languages, increased interaction with AAVE speakers, or an increased tolerance level for differences. These types of interactions could have taken place while being members of various ethnically diverse clubs, dormitory living arrangements, or members of a church choir, where the music generally sung includes lyrics with AAVE influence [15-17].
Other conclusions that can be drawn from this study that would have implications in the field of communicative disorders is that the changing demographics of the United States are challenging preconceived notions of racial bias in the form of music or speech patterns. From this study one can conclude that college aged adults have a more open mind to different types of music. The differences between the locations of geographical upbringings of people do not pose a significant opposition to different speech patterns in music. Additionally, gospel music has roots in all forms of music therefore listeners are more inclined to have favorable ratings despite rational differences.
This is an indication that the study from Koch, Gross, Kolts [7]) results were significant, in that AAVE was rated more favorably in female SAE than in years past. In addition, it suggests that McKibbon’s use of specific markers of AAVE are are more prevalent in ever changing society, therefore new studies on this subject may elicit similar information. Moreover, as stated by Hicks [10] the use of music is able to bridge different linguistic speakers with increased memory, therefore the use of AAVE infused music can be seen as a therapy tool.
Overall, the SAE version was preferred by the male and female SAE speakers. These results were consistent with the researcher’s hypothesis that the SAE speakers would prefer the SAE version to the AAVE version. However, the ratings of the female AAVE speakers were inconsistent with the original hypothesis. It is possible that exposure to a specific dialect of English is a stronger determinant of preferences than the dialect one actually speaks.
Strengths of the Study
One of the strengths of the study was the use of a trained vocalist. The participants’ preferences were based upon the lyrics of the songs and not due to possible bias based on the vocalist. In addition, the vocalist was able to express the lyrical differences in the AAVE as compared to the SAE version. In addition, the researchers were able to gather background information regarding the participants. This information method was important in explaining the raters’ preferences. For example, having information about the communities where the participants grew up provided a possible explanation for the differences in the responses of the male and female AAVE speakers.
Limitations
One of the major limitations of the study was the need to use snowball sampling. AAVE speakers from the midwestern United States were very hard to recruit independently. This was because many of the University of Northern Iowa’s AAVE students have prior exposure to the South. Many were natives of the southern region or had lived there while attending other universities. As a result, the selection pool of possible participants was quite small. On the other hand, the SAE speakers were natives of the Midwest; therefore, the use of the southern AAVE speakers would have created a variable between the groups.
Another limitation to the study was the small number of participants in each group. This limited the types of data analyses able to be used. Therefore, unusual responses by more than one subject could have impacted the results significantly. The use of a larger sample of subjects would be a possible way to investigate whether the findings of the present study are widely applicable.
A third limitation was the possibility that the order in which the songs were presented might have affected the listener responses. In a larger study, the order could have been varied and therefore eliminated the possibility that order would affect the outcome. Additionally, the study was based on reactions to a single gospel song rather than to a variety of songs in varying genres.
Lastly, the lack of research conducted by others in the field as related to young adult AAVE speakers hindered possible comparisons with other published reports. The majority of literature available deals with child AAVE speakers.
Future Research
In addition, to replicating the present study with a larger number of participants, future research should target other issues. In relation to the vocalist, future research could determine if participants are affected by factors such as physical appearance, style of music, and gender of vocalist. Consideration should also be given to the ethnicity of the vocalist as occasionally a listener can determine the ethnic and/or racial background of a vocalist based on his/ her voice. Other genres of music might lead to different results, because listeners might have different expectations for gospel musicians compared to rhythm and blues, rap, country, and so forth.
Additionally, other ways to measure the listeners’ preferences should be considered. The use of open-ended, forced-choice, and theme- or message-related questions is a possible research strategy. Lastly, the researchers could use different sets of bipolar adjectives during the rating preference. Different bipolar adjectives should have more variability between them to acquire a more well-rounded assessment of the individuals’ preferences.
SUMMARY
The results indicated that overall the male AAVE speakers and female SAE speakers rated the AAVE version favorably and both the male and female SAE speakers preferred the SAE version. The latter findings were consistent with the researcher’s hypothesis that the SAE speakers would prefer the SAE version when compared to the AAVE version. However, the female AAVE speakers did not favor the AAVE version, which was inconsistent with the researchers’ hypothesis that the AAVE speakers would prefer the AAVE version when compared to the SAE version. This may show that dialect alone is not a true indicator of individuals’ musical preferences.
REFERENCES
1. Roseberry-McKibbin C. Distinguishing language differences from language disorders in linguistically culturally diverse students. Multicultural Education. 1995; 24: 12-16.
2. Craig HK, Washington JA. Oral language expectations for AfriÊn American preschoolers and kindergartners. Am J Speech Lang Pathol. 2002; 11: 59-70.
3. Pollock KE, Hinton ME. Phonetic transcriptions of African-American Vernacular English. Communication Disorders Quarterly. 2001; 23, 47-53.
4. Smith T, Lee E, McDade HL. An investigation of T-units in African American English-speaking and standard American English-speaking fourth-grade children. Communication Disorders Quarterly, 2001; 22: 148-157.
5. Craig, HK., Washington, JA. An assessment battery for identifying language impairments in African American children. J Speech Lang Hear. 2000; 43: 366-379.
6. Wilcox L, Anderson R. Distinguishing between phonological differences and disorder in children who speak African-American Vernacular English: An experimental testing instrument. J Commun Disord. 1998; 31; 315- 335.
7. Koch L, Gross A., Kolts R. Attitudes toward Black English and code switching. J Black Psychol. 2001; 27: 29- 42.
8. Gross A., Koch L. Children’s perceptions of Black English as a variable in intraracial perception. J Black Psychol. 1997; 23: 215-226.
9. Mora C. Foreign language acquisition and melody singing. English Language Teaching Journal. 2000; 5: 147- 160.
10. Hicks P. The relationship between an oral rhythmic style of communication (rap music) and learning in the urban preschool. Paper presented at the 70th annual meeting of the Association for Education in Journalism and Mass Communication, San Antonio, TX. 1987.
11. Zoller B. Use of music activities in speech language therapy. Language, Speech, and Hearing Services in Schools. 1991; 22:272-276.
12. Patten ML. Understanding research methods (4th ed.). Los Angeles, CA: Pycrzak. 2004.
13. Velleman PF. Data Desk version 6.0: Statistics guide. Ithaca, NY: Data Description. 1997.
14. U.S. Bureau of the Census. 2004 American Community Survey data profile highlights. Washington, DC: Author. 2004.